


Data Visualization Portfolio
Selected projects: Interactive dashboards and visual storytelling
Trump Campaign Promise Tracker
2025-1-10
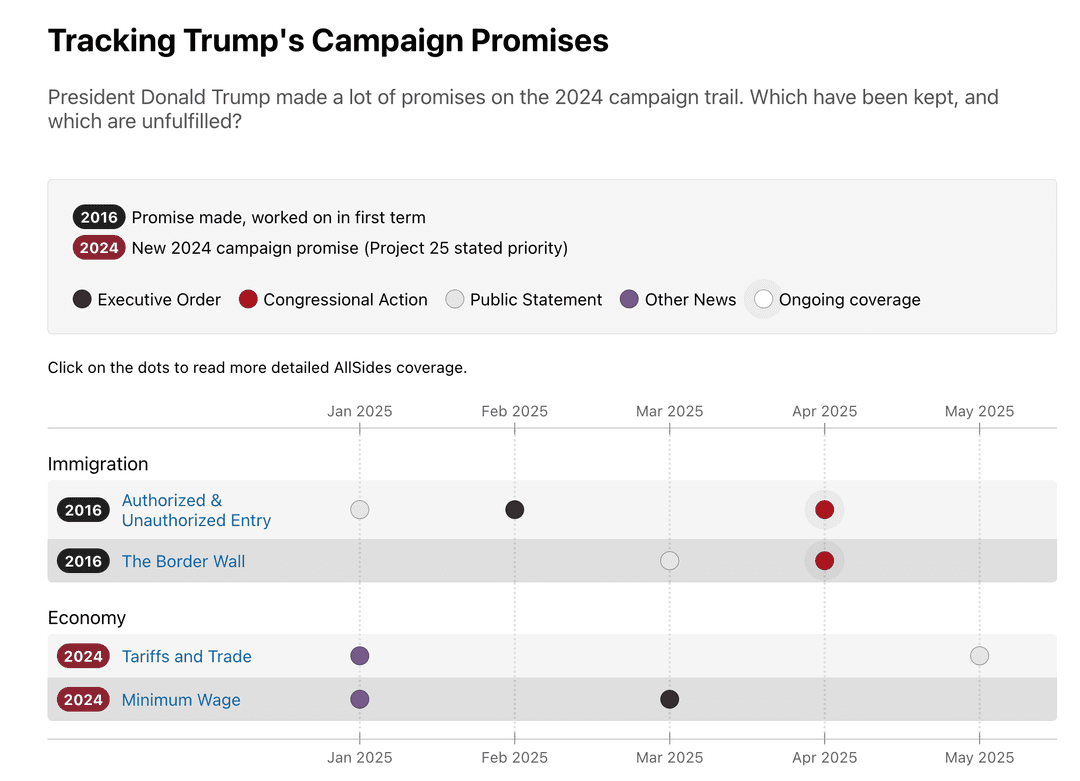
Analysis of news stories in relation to promises made during the 2016 and 2020 campaigns with an interactive chart.
Time Series
Machine Learning
How would you balance the U.S. budget?
2025-1-10

Interactive dashboard to allow user to make policy choices and see if they are able to balance the U.S. budget according to their priorities.
React